Model Performance
Residual Stacked GRU · Evaluation metrics & visualizations
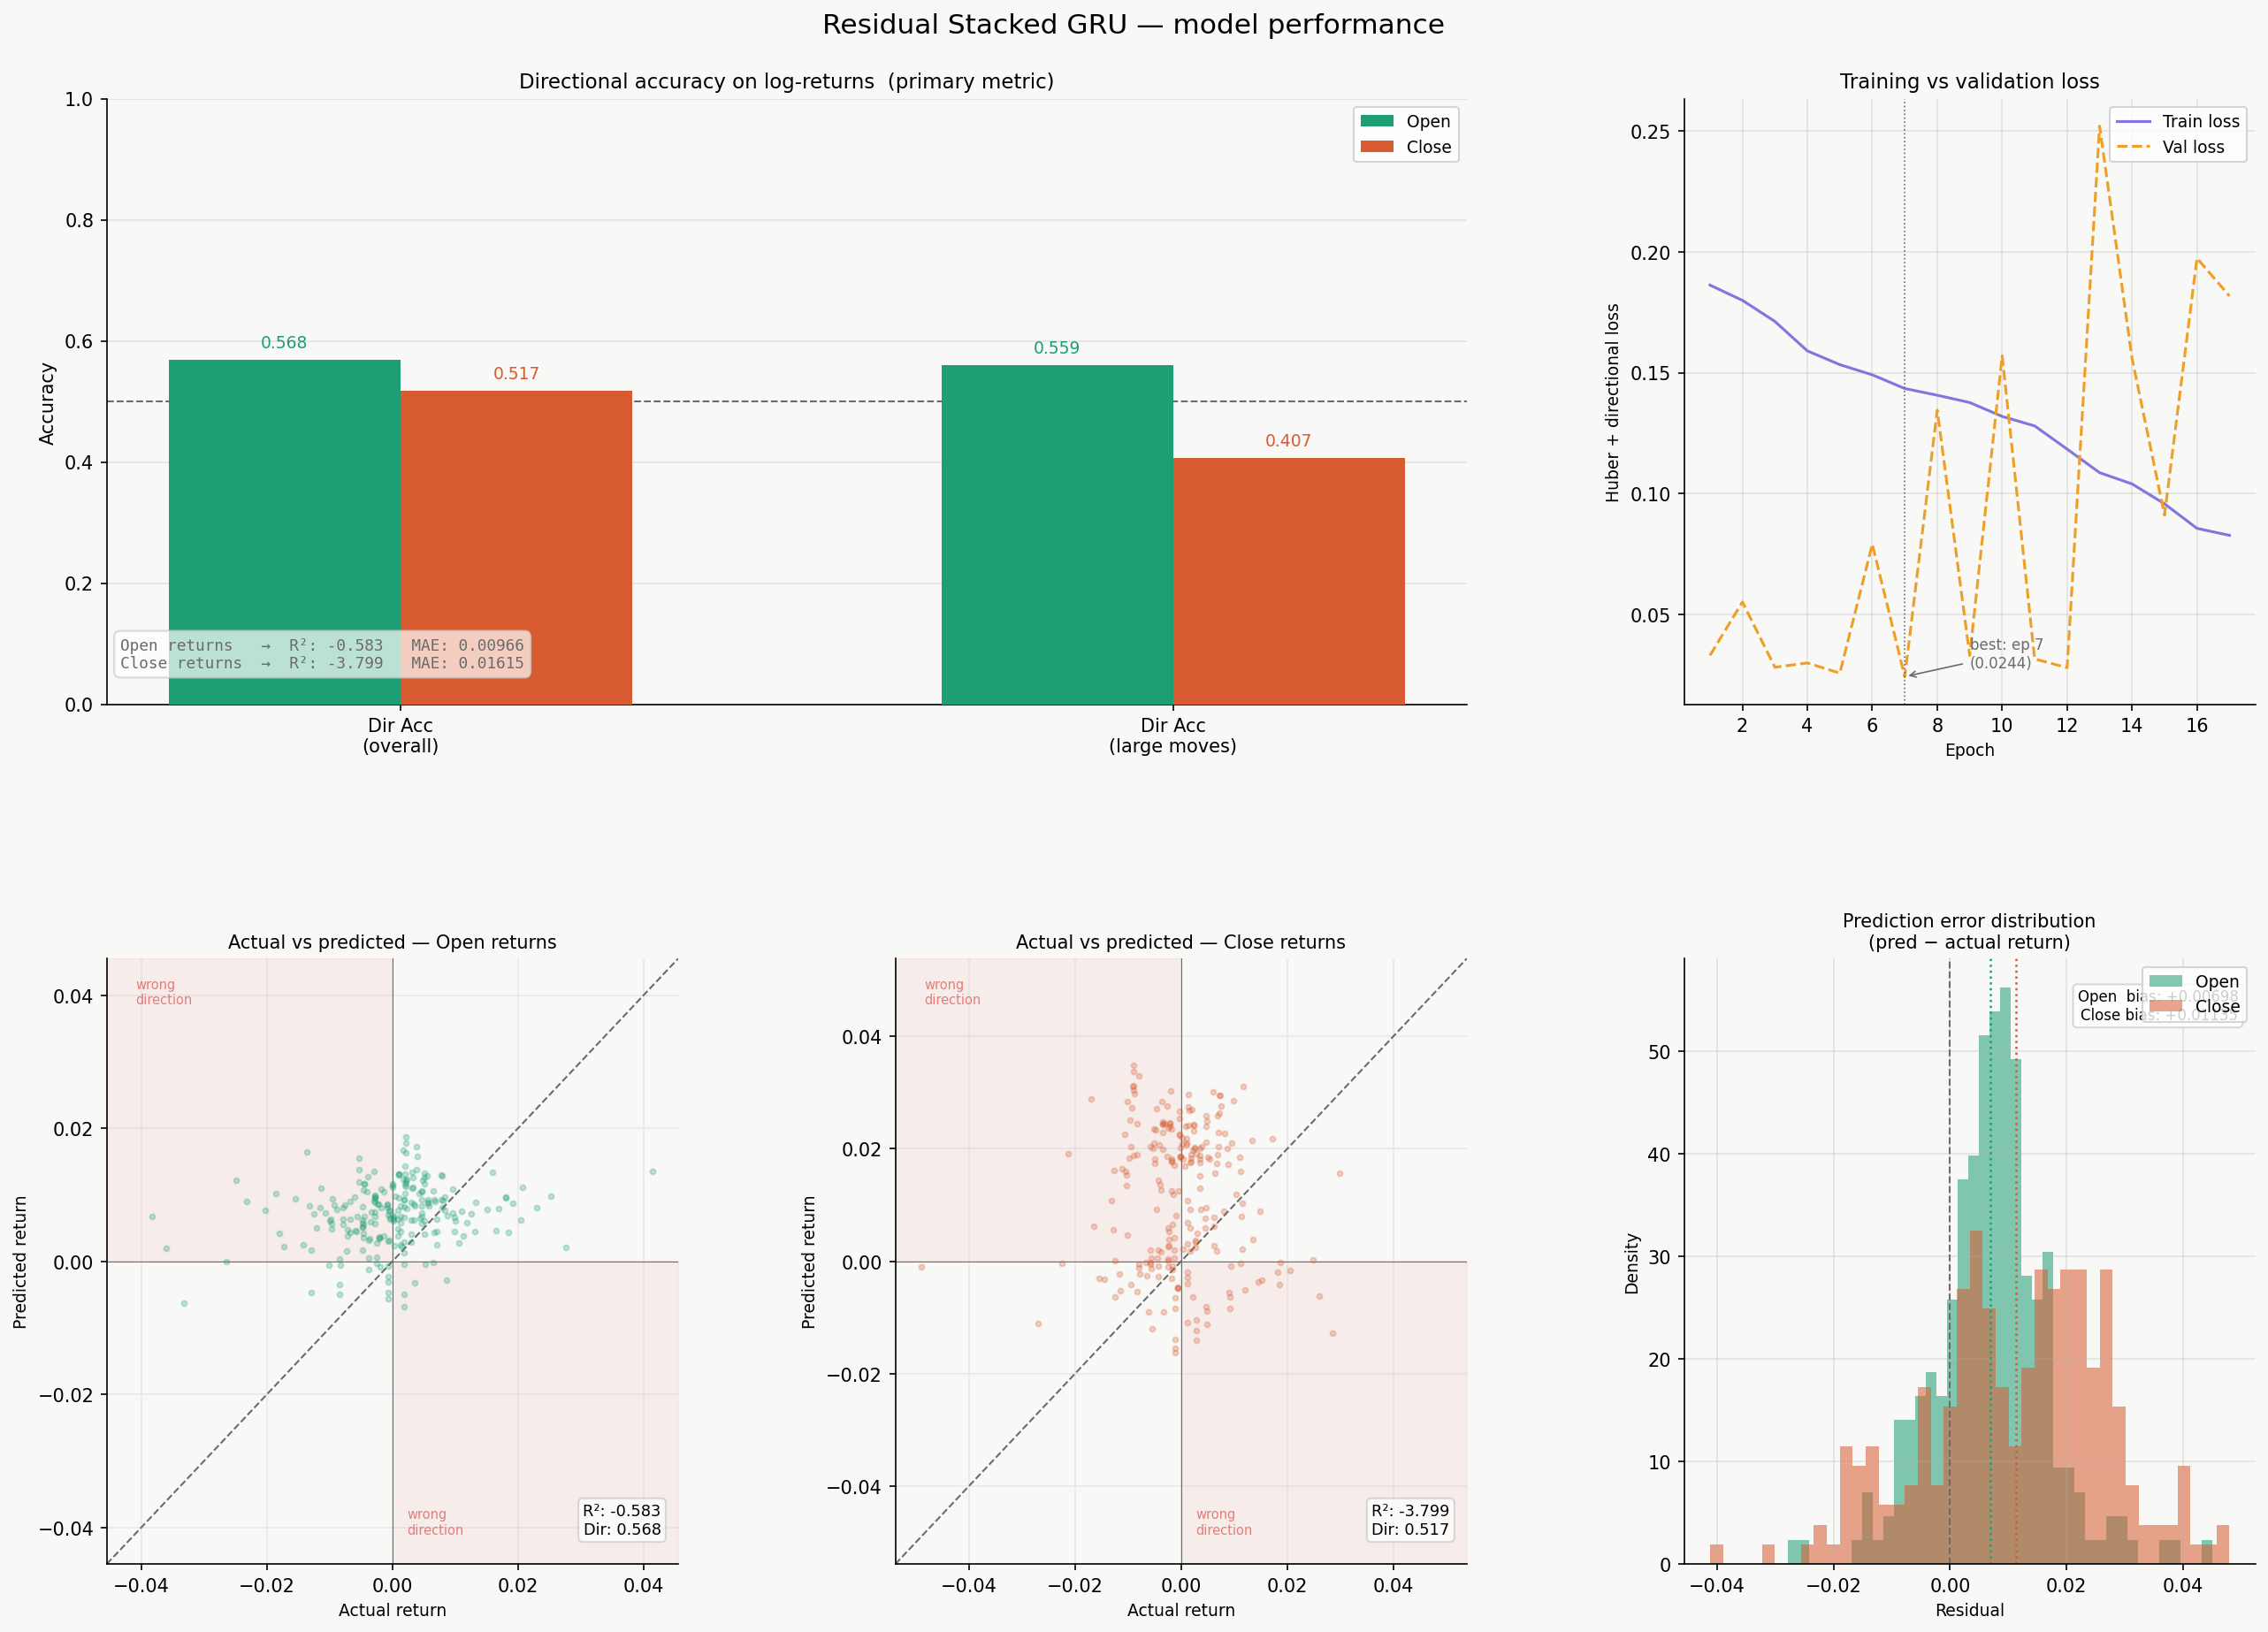
Model Performance Analysis
Detailed Metrics
Using cached fallback metrics| Metric | Open Returns | Close Returns | Open Price | Close Price |
|---|---|---|---|---|
| R² | -0.5826 | -3.7990 | 0.9231 | 0.7927 |
| MSE | 0.0001 | 0.0004 | 41621.4514 | 110373.6803 |
| RMSE | 0.0120 | 0.0194 | 204.0134 | 332.2253 |
| MAE | 0.0097 | 0.0162 | 164.0673 | 276.3165 |
| Direction Accuracy | 0.568 | 0.517 | — | — |
| Direction Accuracy (Large) | 0.559 | 0.407 | — | — |
Metric Explanations
R² (Coefficient of Determination)
Proportion of variance explained. Higher is better (max 1.0).
MSE (Mean Squared Error)
Average squared error. Lower is better.
RMSE (Root Mean Squared Error)
Square root of MSE. Same units as output. Lower is better.
MAE (Mean Absolute Error)
Average absolute error. Lower is better.
Model Architecture
Type: Residual Stacked GRU
Input: 40-day windows of log-returns
Output: Open & Close price log-returns
Loss Function: Huber Directional Loss (δ=0.05, direction_weight=0.25)
Data: 84 months of historical data with 85% train / 15% test split
Powered by GRU · FastAPI · Render · Vercel · For educational purposes only. Not financial advice.